Euro area monetary and financial statistics - Quality report 2024
This biennial data quality report, a key contribution to the ECB Statistics Quality Framework[1], reviews the collection, processing and dissemination of euro area monetary and financial statistics (MFS) for 2023 and 2024. It is aligned with the principles set out in Public commitment on European statistics by the ESCB and includes both descriptive and quantitative quality indicators. Organised into eight sections, the report evaluates key aspects such as statistical developments, methodological soundness, timeliness, availability, accuracy, and internal and external consistency of the data.
Throughout 2023 and 2024, the collection, processing and dissemination of MFS ran smoothly, consistently meeting high quality standards and policy requirements. Significant statistical developments during this period, in many instances also relating to the concept of “methodological soundness”, include the following.
- Euro area enlargement: Croatia’s adoption of the euro in January 2023 and Bulgaria’s planned adoption in January 2026 required adjustments, or groundwork ahead of such adjustments, to euro area aggregate statistics, ECB publications and, where applicable, the production of historical data.
- Investment fund statistics: the recast ECB Regulation concerning statistics on investment funds (ECB/2024/17), adopted in June 2024, introduces more granular data, including detailed breakdowns of assets and liabilities, along with a shift from quarterly to monthly reporting. The implementation is scheduled to happen in 2026 and will provide policymakers with more timely and detailed insights.
- Non-compliance framework: in April 2024, the ECB, together with national central banks, implemented a revised non-compliance framework on statistical reporting. The new framework introduces: clearer definitions of non-compliance; well-defined roles and timelines for stakeholders involved in non-compliance processing; remedial plans designed to address issues constructively; and a more robust methodology for calculating potential sanctions. The new framework also further strengthens transparency through the mandatory publication of sanctions related to statistical reporting, thereby fostering greater accountability. The new framework has already delivered positive results by addressing instances of non-compliance through remedial plans, thus helping to avoid potential sanctions. It has also streamlined NCBs' non-compliance logging to the ECB, enhancing compliance with data quality requirements and alignment with concepts and definitions for the datasets concerned.
- Manual on MFI balance sheet statistics: updated in February 2024, this manual now reflects the changes introduced by the recast Regulation ECB/2021/2. It provides extended guidance on topics such as securitisations, cash management services, and the expanded definition of credit institutions, thus supporting harmonised reporting across countries.
- Payments statistics: in November 2023, the ECB published the first set of payments statistics under the amending Regulation ECB/2020/59. This expanded the scope and frequency of payments statistics, particularly for the retail payments market, with new quarterly data on card payments, credit transfers and e-money transactions. These enhancements have strengthened market oversight, innovation and risk monitoring in payments and payment systems, reinforcing the ECB’s role in ensuring the smooth operation of the European payments ecosystem.
- Insurance corporation statistics regulation: in 2025, the ECB conducted a “merits and costs” exercise to explore possible improvements to Regulation ECB/2014/50. The proposed changes include access to entity-level data, new pricing information, and quarterly reporting on premiums, claims and expenses. Adoption of a recast regulation is expected in 2026.
- Insurance statistics compilation guide: updated in January 2024, the guide now includes changes from the Solvency II taxonomy version 2.8.0 to address data gaps, particularly on liability-side financial transactions related to insurance technical reserves. A minor refinement in April 2025 aligned the guide with evolving national practices and methodologies.
In terms of “timeliness” and “punctuality”, most MFS statistics were transmitted in due course, with only a few delays, (related mainly to investment fund population data). Regarding data and metadata “availability”, no significant issues were identified beyond anticipated levels, thus ensuring the completeness, accessibility and clarity of the data.
Meanwhile, the “accuracy” and “reliability” assessments revealed that revisions to monetary aggregates, including M3, had only a minimal impact on month-on-month growth rates. For example, 88% of revisions to M3 growth rates since August 2005 had an impact of 5 basis points or less at a time lag of t+1. Similarly, revisions to MFI interest rate (MIR) statistics were limited: 71% did not exceed 5 basis points and 24% took place within a month of the initial release, thus qualifying as ordinary revisions.
“Consistency” checks confirmed that data levels remained largely stable in 2023 and 2024 as regards the internal consistency of the datasets, while external consistency checks compared loan-level AnaCredit data and individual MFI balance sheet (IBSI) data to ensure consistency and completeness in reporting. These checks, which have been performed quarterly since 2021, enhance data quality and support the eventual integration of granular and aggregate statistical reporting through the implementation of the Integrated Reporting Framework (IReF). Similarly, quarterly cross-checks on the data of financial vehicle corporations and MFI balance sheet items further ensure the reliability and coherence of the data.
In summary, the ECB’s statistical processes for 2023-24 continued to meet high quality standards across the various key aspects monitored, effectively supporting the Eurosystem’s policy and operational needs. The significant developments and updates outlined in this report underscore the ECB’s ongoing commitment to enhancing its statistical frameworks to address evolving analytical and oversight requirements.
In keeping with the Eurosystem’s mission statement[2], the ECB upholds values such as credibility, trust, transparency and accountability, which are fundamental to the integrity of its statistical function as outlined in the Treaty on the Functioning of the European Union and in Article 5 of the Statute of the European System of Central Banks and of the European Central Bank[3]. Ensuring adherence to statistical standards of quality is crucial for sustaining public confidence in European System of Central Banks (ESCB) statistics, which form the basis for monetary policy decisions and other Eurosystem tasks. This commitment also guarantees the comparability of euro area and national statistics on a global scale.
In fulfilling its statistical responsibilities, the ESCB prioritises good governance, high ethical standards and cooperation. This report is aligned with the Public commitment on European statistics by the ESCB, which outlines the shared principles governing ESCB statistics. The principles and guidelines underpinning the production of ECB statistics are further detailed in the Statistics Quality Framework and the associated of quality assurance procedures.
The ESCB statistical function collects all the data needed to produce and disseminate reliable, timely, consistent and accessible statistics within its areas of responsibility. The primary objective of euro area MFS is to support the ECB’s monetary policy and the broader tasks of the Eurosystem and the ESCB. These statistics also contribute to other EU policies and adhere to European and internationally recognised standards, guidelines and best practices.
The data collection frameworks for euro area MFS cover a wide range of reporting entities, including national central banks (NCBs), credit institutions, insurance corporations (ICs), pension funds (PFs), money market funds (MMFs), investment funds (IFs), financial vehicle corporations (FVCs), payment institutions and electronic money institutions, among others. These frameworks apply to statistics on MFI balance sheet items and to data on ICs, PFs, FVCs and IFs. They also cover MIR statistics and payments statistics, encompassing data on payment services, large-value payment systems and retail payment systems. The scope of this report is aligned with the mandate of the Working Group on Monetary and Financial Statistics (WG MFS), the relevant ESCB reporting committee.
Statistics on MFI balance sheet items are central to the ECB’s monetary policy operations, offering essential insights into monetary developments in the euro area (e.g. monetary aggregates) and into MFI activities more broadly (e.g. outstanding loans to and deposits from households and non-financial corporations (NFCs)). MIR statistics also happen to play a key role in analysing the monetary policy transmission mechanism and the pass-through of official and market interest rates to retail banking interest rates. Additionally, they provide valuable information on the level of integration within the euro area’s retail banking markets.
1.1 Scope of data coverage and structure of the report
This report addresses various dimensions of data quality, focusing on: (i) methodological issues caused by national compilers diverging from statistical standards or requiring enhanced statistical procedures; (ii) compliance among NCBs with their obligation to transmit data and metadata to the ECB in terms of timeliness and coverage; (iii) the reliability of statistical data; (iv) the internal consistency of statistics; and (v) external consistency with other statistical domains or datasets.
To present these aspects effectively, the report is structured into eight sections: Section 1: Introduction; Section 2: Statistical developments between 2023 and 2024; Section 3: Methodological soundness and statistical procedures; Section 4: Timeliness and punctuality; Section 5: Availability of data and metadata; Section 6: Accuracy and reliability; Section 7: Internal consistency; and Section 8: External consistency/coherence.
1.2 Current legal framework
The main concepts underpinning the statistical requirements discussed in this report derive from international statistical frameworks, specifically the System of National Accounts (SNA) and the European System of National and Regional Accounts (ESA 2010). Compliance with these standards helps to ensure the international comparability of national and euro area statistics, while providing a robust methodological basis for data aggregation.
According to Article 5 of the Statute of the ESCB and the ECB, the ESCB is authorised to collect statistical information from competent national authorities or directly from economic agents to fulfil its responsibilities, which include monetary policy, financial stability and banking supervision.
To support the Eurosystem’s operations, the ECB is empowered to enact legal instruments that directly affect certain economic agents within the euro area, such as monetary financial institutions (MFIs) and other financial corporations. The ECB’s Governing Council adopts regulations establishing binding statistical requirements for relevant euro area entities. These regulations are “directly applicable”, meaning they do not require transposition into national legislation. They provide reporting entities with detailed instructions on statistical reporting obligations, including definitions, classifications, frequency and timeliness. Table 1 below outlines the ECB regulations relevant to the collection of the statistics discussed in this report. Furthermore, NCBs may issue additional national-level instructions for the direct submission of reporting data to them, in a process known as “primary reporting”.
Table 1
Existing legal framework for ECB statistics
Existing regulations for ECB statistics
Dataset |
ECB regulation/guideline |
|---|---|
BSI |
Regulation (EU) 2021/379 of the European Central Bank of 22 January 2021 on the balance sheet items of credit institutions and of the monetary financial institutions sector (recast) (ECB/2021/2). |
MIR |
Regulation (EU) No 1072/2013 of 24 September 2013 concerning statistics on interest rates applied by monetary financial institutions (recast) (ECB/2013/34). |
IVF |
Regulation (EU) No 1073/2013 of 18 October 2013 concerning statistics on the assets and liabilities of investment funds (recast) (ECB/2013/38) – applicable until November 2025. |
FVC |
Regulation (EU) No 1075/2013 of the European Central Bank of 18 October 2013 concerning statistics on the assets and liabilities of financial vehicle corporations engaged in securitisation transactions (recast) (ECB/2013/40). |
PSS |
Regulation (EU) No 1409/2013 of the European Central Bank 28 November 2013 on payments statistics (ECB/2013/43) – applicable up to and including reference year 2021. |
IC |
Regulation (EU) No 1374/2014 of the European Central Bank of 28 November 2014 on statistical reporting requirements for insurance corporations (ECB/2014/50). |
PF |
Regulation (EU) No 2018/231 of the European Central Bank of 26 January 2018 on statistical reporting requirements for pension funds (ECB/2018/2). |
Note: For PSS, the last applicable reference year is 2021. From then onwards, these data have been split and expanded into fourteen new payments and settlement systems data structure definitions (PAY DSDs), while three DSDs (SSP, BSP and BKN) have continued under the former framework. Further details on ECB Data Portal.
The ECB also issues statistical guidelines that are binding on members of the Eurosystem, specifying the data that central banks must submit to the ECB, along with the deadlines, formats and other relevant details. Where specific statistics are not governed by an ECB regulation, guidelines are used instead to communicate the ECB’s data requirements to euro area NCBs, often granting them some degree of flexibility in selecting data sources, as long as they adhere to established standards. Beyond outlining the framework under which NCBs must transmit the data collected under applicable regulations, the guidelines often impose additional requirements. In these cases, NCBs are expected to provide data on a best-effort basis, depending on data availability. This includes statistics on entities not covered by an ECB regulation, such as consolidated banking data and information on certain other financial intermediaries, as well as complementary data that go beyond the scope of existing regulatory requirements. One such example would be data on undrawn credit lines offered by MFIs.
With the economic landscape in constant flux, the ECB endeavours to ensure that its statistics remain relevant and cater to the demands of a dynamic financial environment, ongoing financial innovation, and shifting user requirements. It also adapts its frameworks to changes in the composition of the euro area arising from new Member State accessions.
This section outlines the most significant developments to have occurred during the reporting period.
2.1 Adoption and implementation phase of the new investment fund statistics regulation
The recast ECB Regulation on investment fund statistics (ECB/2024/17[4]) was adopted in June 2024. The related Guideline, which specifies the data that NCBs must transmit to the ECB, was amended in October 2024 (ECB/2024/27[5]).
The new features include additional aggregated breakdowns of assets and liabilities, new information on income and fees, granular information on securities without publicly available identification codes, and information on the classification of investment funds. Data will also be made available on a monthly basis, whereas previously most data were required quarterly. Moreover, NCBs must transmit to the ECB additional data on individual investment funds, which is a cost-effective way of providing ESCB users with more granular information on the sector, as NCBs already collect the data on a fund-by-fund basis.
Following the implementation phase, NCBs will begin transmitting the enhanced aggregated data to the ECB in February 2026 (referring to December 2025 data). Transmission of data on individual investment funds will begin in September 2026 (referring to June 2026 data).
2.2 Revised non-compliance framework for statistics
The ECB, working alongside NCBs, has implemented a comprehensive non-compliance framework to ensure the accuracy and reliability of the statistical data it collects under its reporting obligations. These data are essential for the effective functioning of the Eurosystem and the framework covers a broad range of statistics, such as balance sheets and interest rates of MFIs, IFs, FVCs, payment systems, ICs, PFs, and other key statistics. These statistics underpin the ECB’s ability to make informed, data-driven decisions and uphold transparency in its operations.
The non-compliance framework has been reviewed and strengthened, with the updated provisions taking effect in April 2024. Key updates include clearer definitions of non-compliance, an enhanced procedural framework for addressing breaches and, for the first time, the introduction of remedial plans. These changes aim to promote a more constructive and transparent resolution of instances of non-compliance cases while maintaining appropriate enforcement measures.
The framework is built on four key components:
First, the revised ECB Regulation (ECB/2022/31[6]) on infringement procedures clarifies the roles of the ECB and NCBs in addressing instances of non-compliance. It also introduces the concept of remedial plans, which set out concrete steps and actions agreed to with the non-compliant reporting agents so that they may address the issues within a specified timeframe. This helps to ensure that most cases can be resolved consensually, thus avoiding a potential sanction.
Second, a new ECB Decision (ECB/2022/32[7]) establishes a detailed methodology for calculating sanctions in cases of statistical non-compliance. This methodology follows a two-stage approach: the first stage focuses on quantitative factors to determine a baseline amount, while the second stage considers qualitative factors to adjust that amount where relevant.
Third, the framework includes a new manual that operationalises the provisions of the Decision. While not legally binding, the manual provides practical guidance on how to handle the operational aspects of the sanctioning process, ensuring a consistent and transparent approach across the Eurosystem.
Fourth, a set of revised internal guidelines and procedures require NCBs to log and report all alleged instances of non-compliance to the ECB without undue delay, thus allowing the ECB to monitor and address potential breaches more effectively, particularly when sanctions may be necessary.
Finally, the above changes were complemented with further significant changes to ECB Regulation ECB/1999/4 (ECB/2023/13[8]) to enhance the transparency and accountability of ECB decisions to impose sanctions in its non-supervisory role. These amendments are meant to amplify the deterrent effect of such sanctions, while aligning ECB practices with applicable legal requirements under the Single Supervisory Mechanism (SSM). To that end, the updated Regulation strengthens this framework by requiring the mandatory publication of all sanctions issued by the ECB in relation to statistical reporting, unless specific conditions warrant withholding publication.
Together, these measures make the ECB more adept at enforcing compliance with statistical reporting requirements, while supporting high-quality data collection and building trust in the functioning of the Eurosystem. The updated framework reflects the ECB’s commitment to fair, proportional and transparent enforcement, while enabling constructive solutions wherever possible.
The new framework has already delivered positive results, as instances of non-compliance have been effectively resolved in line with the agreed remedial plans. This approach has not only helped to avoid potential sanctions, but has also ensured that reporting agents remain compliant with their obligations. Moreover, the new framework has streamlined the process whereby NCBs log non-compliances with the ECB, thereby reducing their administrative burden. It also allows for more effective monitoring of compliance with data quality standards, as well as the associated concepts and definitions, by introducing thresholds for the datasets concerned.
2.3 Publication of the updated manual on MFI balance sheet statistics
In February 2024, the ECB published a new version of its Manual on MFI balance sheet statistics, which is a useful resource for reporting agents, compilers and users of the statistics. It aims to ensure a common understanding of the reporting requirements by further clarifying and illustrating them, mainly through the use of extended definitions, explanations of the underlying concepts, and examples. While it may supplement the information contained in ECB legal acts, the guidance it provides is not in itself legally binding.
The new version of the manual reflects the adoption of a recast Regulation (ECB/2021/2)[9] and Guideline (ECB/2021/11)[10], since the previous version was published in January 2019. The recast Regulation introduces new reporting requirements to enhance the analysis of monetary and credit developments, while also amending some existing reporting requirements, definitions and reporting derogations to ensure better integration with other statistical datasets. Among other new breakdowns, key changes include new requirements governing securitisations and other loan transfers, as well as cash management services (i.e. notional cash pool positions), which are now included in the calculation of the headline figures for “adjusted loans”. The manual also provides further information on the definition, reporting requirements and derogations relating to “non-MFI credit institutions”. This category was created under Regulation ECB/2021/2 in response to the broader definition of “credit institution” provided under Article 4(1)(1) of the Capital Requirements Regulation to also cover systemically important investment firms.
The manual also reflects the ongoing efforts of the WG MFS to enhance standardisation and harmonisation of BSI reporting practices across countries and with other statistics. Examples include additional guidance on the classification of loans to households by loan purpose and the statistical treatment of operational leases and emissions allowances.
2.4 Euro area enlargement and ECB statistics: Croatia
On 1 January 2023, Croatia adopted the euro, effectively becoming the 20th member of the euro area. In preparation for this event, the already effective collaboration between the ECB’s statistical function and its counterparts at Hrvatska narodna banka was further enhanced for the purpose of implementing the necessary adjustments. These efforts ensured the availability of the statistics and data required under the ECB’s reporting framework and facilitated the compilation and dissemination of aggregated euro area statistics reflecting its enlarged composition.
This work involved a range of statistical activities deemed essential for Croatia’s accession, including the need to modify technical and reporting procedures, adapt statistical collection, production and dissemination systems, and configure the delivery of historical data backflows in euro for the first time. Additionally, adjustments were made to existing ECB publications to align them with the established concepts for euro area aggregates – whether based on fixed or changing composition – and national breakdowns, as appropriate.
The activities followed a tried and tested approach used in previous euro area enlargement processes. However, considerable preparatory work was needed to integrate Croatia’s data collection and reporting system into the granular and micro-level datasets developed by the ESCB since the previous enlargement, such as the AnaCredit dataset and securities holdings statistics. Most of these activities were completed by the end of June 2023 and included the transmission of historical data to the ECB in euro, instead of national currency as used for previous transmissions, the compilation of euro area aggregate statistics reflecting the revised composition, and the full alignment of ECB publications.
2.5 Publication of enhanced payments statistics
In November 2023, payments statistics collected in accordance with Regulation ECB/2020/59 amending Regulation ECB/2013/43 were published for the first time, marking a key milestone in the evolution of this field of statistics. The amending Regulation, which entered into force on 1 January 2022, significantly widened the scope of data collection and increased its frequency (in most cases from annual to semi-annual, although certain high-level indicators and some detailed data on card payment transactions are now collected quarterly). This ensures that users receive more timely and granular insights into payment instruments, behaviours, systems and market developments. The new framework reflects extensive methodological updates stemming from the improvements made to relevant EU legislation in this field, such as Directive (EU) 2015/2366 on payment services in the internal market and Regulation (EU) 2015/751 on interchange fees for card-based payment transactions. Notably, the framework places particular emphasis on providing more detailed data on card payments.
As a result, payments statistics for the reference years 2023 and 2024 provide a more reliable picture of the retail payments market across the euro area and the wider EU. The published data include detailed information on card payment transactions – both in aggregated form and broken down (e.g. by initiation channel, merchant category code or cross-border activity) – as well as credit transfers, direct debits and e-money payments. Additional indicators on the availability of payment terminals and accepting devices illustrate the continued digitalisation of payment services across EU Member States.
These data allow for closer monitoring of innovation in payment methods and support swifter policy responses to emerging risks and trends in the European payments ecosystem. The regular semi-annual and quarterly publication cycles also provide policymakers and market participants with more up-to-date data for analytical and oversight purposes. The data are vital for monitoring developments in payment markets and supporting the smooth and secure functioning of the European payment ecosystem. Since payment instruments operate through payment systems and are governed by payment schemes, comprehensive statistics on these – including those used to closely monitor developments in payment fraud – help safeguard public confidence and the efficiency of payment services.
It should be noted that the implementation of Regulation ECB/2020/59 by some non-euro area EU countries was still ongoing during the 2023 and 2024 reporting cycles. As a result, EU aggregates for certain indicators reflect only partial EU coverage.
The ESCB has published detailed methodological documentation and comprehensive metadata to support transparency and comparability across countries and over time. Overall, this strengthened statistical framework in the field of payments underpins the relevance of monetary and financial statistics in supporting the Eurosystem in its statutory task of promoting the smooth operation of payment systems and the wider implications of this.
A “sound methodology” refers to the development and compilation of statistics based on the statistical framework outlined in ESCB and EU legislation, as well as internationally recognised standards, guidelines and best practices. In this context, it is important to note that the principles underpinning the ECB’s statistical requirements for MFS are derived from global statistical frameworks, such as the SNA and ESA 2010. Compliance with these standards ensures international comparability of national and euro area statistics, while providing a robust methodological foundation for data aggregation.
Additionally, during the reference period of this report, the WG MFS held various methodological discussions during the reference period of this report with the aim of improving the overall soundness of the methodology applied.
This section addresses various methodological challenges that arose during the period.
3.1 Merits and costs of updating the ECB regulation on insurance corporation statistics
ECB statistics on insurance corporations are collected in accordance with Regulation ECB/2014/50. To ensure that the data collected under the Regulation remain relevant, certain enhancements have been proposed. More precisely, a “merits and costs” exercise was carried out in 2025, and the ECB also plans to launch a public consultation on a draft recast Regulation in early 2026.
The proposed changes include:
- access to individual entity-level data;
- new information on the price of insurance;
- quarterly information on premiums, claims and expenses;
- more detailed information on assets and liabilities.
The recast ECB IC regulation is set to be drafted and adopted in the first half of 2026, after which an implementation phase will begin.
3.2 Updated compilation guide on insurance corporation statistics
The Insurance corporation statistics compilation guide was revised in January 2024 to incorporate the changes made to Solvency II reporting by taxonomy update 2.8.0, which included new ECB add-ons. These add-ons were designed to address identified data gaps, particularly those related to financial transactions of liability-side balance sheet items, and to ensure the production of high-quality statistical data as required under Regulation ECB/2014/50. The compilation guide underwent further minor updates in April 2025 to reflect changes in national practices and to update the methodology for calculating financial transactions of non-life technical provisions.
3.3 Preparation for euro area enlargement: Bulgaria
Bulgaria is set to adopt the euro on 1 January 2026, whereupon it will become the 21st member of the euro area, following Croatia’s accession in 2023. In preparation for this major milestone, the ECB and Българска народна банка (Bulgarian National Bank) have been cooperating closely to ensure that the necessary adjustments are made to meet the ECB’s statistical reporting requirements and to facilitate a smooth compilation and dissemination of aggregated euro area statistics that reflect the enlarged composition of the monetary union.
This process encompasses a wide range of statistical activities required for accession. These include amendments to technical and reporting procedures, adjustments to statistical collection, production and dissemination systems, both at NCB and ECB level, and the configuration of historical data backflows to be reported in euro for the first time. Meanwhile, updates are being made to ECB publications to align with the established framework for euro area aggregates, whether based on fixed or changing composition, and to account for national breakdowns where applicable.
This groundwork builds on tried and tested approaches used in previous euro area enlargements, while incorporating the latest advancements in statistical methodologies. Special emphasis has been placed on integrating Bulgaria's data collection and reporting systems into the granular and micro-level datasets developed by the ESCB, including complex datasets such as the analytical credit dataset (AnaCredit) and securities holdings statistics.
Most of the preparatory activities are expected to be completed by mid-2026, including the full production of historical data, the compilation of euro area aggregate statistics reflecting its enlarged composition, and updates to all ECB publications in line with release calendars. These efforts will ensure that Bulgaria’s transition to the euro is supported by robust and reliable statistical systems, thus supporting its smooth integration into the euro area.
The concept of “timeliness”, which includes “punctuality”, means that MFS, along with other ECB statistics, must be provided promptly and as agreed between the parties. More precisely, timeliness means the interval between the occurrence of an event or phenomenon and the availability of the corresponding statistical information, while “punctuality” pertains to the ideally non-existent gap between the actual release date of the data and the scheduled release date.
ECB regulations and guidelines set explicit deadlines for the collection and transmission of statistics from NCBs to the ECB. These timelines are predicated on predefined and mutually agreed schedules.
Table 2 below outlines the specific timelines and reporting frequencies for each type of statistic.
Table 2
Transmission dates for national contributions to the ECB for each type of statistics
Statistics |
Relevant regulation |
Reporting frequency |
Working days after the reference period |
|---|---|---|---|
MFI balance sheet items |
Regulation ECB/2021/2 |
Monthly |
t+15 |
Quarterly |
t+28 |
||
MFI interest rate |
Regulation ECB/2013/34 |
Monthly |
t+19 |
Investment funds |
Regulation ECB/2013/38 and Guideline ECB/2021/12 (applicable until November 2025) |
Monthly |
t+28 |
Regulation ECB/2024/17 and Guideline ECB/2024/27 (applicable from December 2025) |
Quarterly (applicable for Regulation ECB/2013/38 and Guideline ECB/2021/12) |
t+28 |
|
Financial vehicle corporations |
Regulation ECB/2013/40 and Guideline ECB/2021/12 |
Quarterly |
t+28 |
Insurance corporations |
Regulation ECB/2014/50 and Guideline ECB/2021/12 |
Quarterly |
t+35 |
Annual |
t+80 |
||
Pension funds |
Regulation ECB/2018/2 and Guideline ECB/2021/12 |
Quarterly |
t+45 |
Annual |
t+80 |
||
Payments |
Regulation ECB/2013/43 and Guideline ECB/2014/15 until the 2021 reference period |
Annual |
Annual – by close of business on the last working day of May |
Regulation ECB/2020/59 and |
Quarterly and semi-annual as of 2022 |
Quarterly – by close of business on the last working day of May, August, November and February Semi-annual – by close of business on the last working day of November and May |
Source: ECB.
Note: If a national public holiday falls on the relevant working day in at least three euro area Member States, the transmission date is postponed by one day. A maximum postponement of three working days may be granted, where applicable.
Compliance among reporting agents with the transmission dates stipulated by their NCBs, which in turn allow the NCBs to transmit data to the ECB as outlined in Table 2, is closely monitored by the NCBs, with any infringements to be reported to the ECB. Repeated failures to report data in due course may result in a sanction for the reporting agent concerned.
During the reference period of this report, i.e. from January 2023 to December 2024, most reporting agents transmitted their data promptly and relatively few cases of non-compliance occurred in respect of timeliness, as shown in Table 3. Most of these failures related to IFs subject to reporting under Regulation ECB/2013/38. Only a handful of these cases ultimately led to the initiation of a remedial plan, which succeeded in addressing all outstanding issues.
Table 3
Alleged non-compliances with timeliness requirements from 2023 to 2024
Statistics |
Relevant regulation |
Reporting frequency |
Number of NCBs involved |
Number of entities involved |
Number of infringements |
|---|---|---|---|---|---|
MFI balance sheet items |
Regulation ECB/2021/2 |
Monthly |
1 |
1 |
3 |
Quarterly |
2 |
3 |
5 |
||
MFI interest rate |
Regulation ECB/2013/34 |
Monthly |
|||
Investment funds |
Guideline ECB/2021/12 Regulation ECB/2013/38 |
Monthly |
2 |
12 |
45 |
Quarterly |
1 |
8 |
28 |
||
Financial vehicle corporations |
Regulation ECB/2013/40 |
Quarterly |
1 |
2 |
3 |
Insurance corporations |
Regulation ECB/2014/50 and Guideline ECB/2021/12 |
Quarterly |
|||
Annual |
|||||
Pension funds |
Regulation ECB/2018/2 and Guideline ECB/2021/12 |
Quarterly |
|||
Annual |
|||||
Payments |
Regulation ECB/2013/43 and Guideline ECB/2014/15 until the 2021 reference period |
Quarterly |
|||
|
Regulation ECB/2020/59 and Guideline ECB/2021/13 as of 2022 |
Annual until the 2021 reference period Quarterly and semi-annual as of 2022 onwards |
Source: ECB.
In addition, delays in the transmission of BSI and FVC data by three NCBs were observed on a total of 13 occasions.
5.1 Completeness
Completeness checks are conducted for MFS to identify any missing information. If any data gap is detected, the relevant NCBs are promptly contacted and asked to provide the missing data as soon as possible.
Ensuring the completeness of metadata is also critical, as it enhances the reliability and overall quality of MFS. Significant efforts are made to prioritise the use of standardised concepts, established data structures and internationally recognised code lists, or at least those agreed upon with other international statistical bodies. This approach helps reduce costs, alleviate the reporting burden and address data governance concerns, such as the need to ensure data confidentiality.
Data transmissions in 2023 and 2024 were comprehensive and adhered to the established deadlines. Only minor inconsistencies were observed, all of which were resolved swiftly, with no impact on the production of the relevant data.
5.2 Accessibility
The term “accessibility” refers to the conditions under which data and metadata are provided, ideally in a manner that is clear, easy to understand and readily available to all users, thus ensuring that meaningful interpretations can be made. Essentially, it measures how easily data can be accessed or, conversely, the extent to which confidentiality constraints limit public access to certain data.
The ECB focuses primarily on compiling and disseminating MFS related to euro area aggregates, including country-level data for both euro area and non-participating Member States. These data typically encompass the following:
- stock data, referring to the value of assets and liabilities on the last day of the reference period (e.g. month or quarter), typically the last calendar day;
- financial transactions (flows), referring to the current period and usually calculated by deducting the effect of factors that do not relate to transactions from the change in stocks over the period (e.g. reclassifications and revaluation adjustments);
- reclassifications and other adjustments, covering changes in balance sheet stocks arising from changes in the composition and structure of the reporting population, changes in the classification of financial instruments and counterparties, changes in statistical definitions and the (partial) correction of reporting errors;
- revaluation adjustments, resulting from changes in the prices of assets and liabilities, changes in exchange rates affecting assets and liabilities denominated in foreign currencies, and write-offs or write-downs of loans;
- exchange rate adjustments, typically relating to instruments denominated in non-euro currencies but reported in euro;
- new business, interest rates and volumes, referring to all new agreements on interest rates, including renegotiations of existing agreements, over the course of one month;
- pure new loans, calculated as the difference between total new business and renegotiations, thus offering a measure of the gross flow of new credit and enabling users to assess the MFI’s credit market stance;
- indexes of notional stocks, usually computed as the following chain index: I(t) = I(t-1)*[1+F(t)/S(t-1)], where F(t) are transactions during the period and S(t-1) are stocks at the end of the previous period;
- growth rates, which typically refer to an index of notional stocks, rather than to stock data directly, making it possible to pinpoint the latest developments in the series free from the distortions that non-transactions would have on stock growth rates.
Table 4 below provides a detailed overview of the types of data published under the various MFS reporting frameworks.
5.3 Clarity
The term “clarity” refers to the “information environment” surrounding the data. Efforts are made to ensure that MFS, data and explanatory material remain relevant and are presented in a clear, unambiguous way that supports and promotes their use by all types of users. Moreover, statistical releases are accompanied by a clear description of the main messages to explain the relevance and meaning of the data in a way that is not materially misleading.
Useful data visualisations, including charts, tables and dashboards, are published either in the form of ECB publications or through the ECB Data Portal and are designed to assist the interpretation of MFS data.
A wide range of MFS is published on the ECB website on a monthly and quarterly basis. In addition, annual statistical press releases are issued in line with a pre-announced release calendar, outlining the latest data and the relevant economic developments.
To accommodate different user needs, MFS data are published through several avenues and in various formats, ranging from regular ECB publications, such as the Economic Bulletin, to those providing additional details, such as the newly introduced ECB Data Portal, the euro area statistics website and the relevant dashboards, such as the one for bank interest rate statistics.
This section presents the results of the quantitative checks carried out to analyse the magnitude of data revisions affecting the compilation of monetary aggregates and MIR statistics. When drawing up the previous quality report, covering the period from January 2021 to December 2022, the quality checks were adjusted to account for the changes introduced by the recast BSI regulation (ECB/2021/2). In contrast, in the period covered by this quality report (January 2023 to December 2024), the quality checks remained stable.
The overall quality of published data has remained very high and stable over time, thus ensuring that the statistical data collected has provided reliable input for the ECB’s policy needs in 2023 and 2024.
6.1 Revisions to MFI balance sheet and interest rate statistics
The revision analysis set out in this section assesses the reliability of first releases. This is an important quality feature, alongside compliance with harmonised definitions, the timely incorporation of methodological changes and consistency with other statistics. Note that a small number of revisions to first data releases is not necessarily an indication of high data quality. This is because revisions typically improve statistics, not least because they can mitigate the impact of potential trade-offs between different characteristics of output quality (e.g. timeliness and accuracy of reported data).
For MFI balance sheet and MIR statistics, data releases are typically revised to ensure that the statistics remain up to date and relevant. The only constraint is that NCBs must submit revisions to monthly BSI data at the same time as their quarterly MFI balance sheet statistics so as to ensure the consistency of monthly and quarterly statistics. As BSI data collected on a quarterly basis provide more detailed breakdowns, they may reveal errors in monthly BSI data and lead to the corresponding revisions. Exceptional revisions may happen with any release, perhaps due to reclassifications or improved reporting procedures.
A distinction is made between regular and ad hoc/exceptional revisions, which are usually accompanied by explanatory notes. Data are generally considered to be “provisional” on first release; the expectation is therefore that regular revisions will be included in the next monthly update at t+1. Ad hoc/exceptional revisions attributable, for example, to reclassifications or improved reporting procedures may be carried out to coincide with any release and may even go back as far as 2003, depending on the indicators concerned.
Revisions of euro area MFI balance sheet statistics
In the analysis below, vintage data in the data repositories have been used to analyse how the monthly revisions received between August 2005 and December 2024 at t+1, t+3, t+6 and t+12 months have cumulatively had an impact on the monetary aggregates and their components following their initial publication in press releases.[11]
Revisions having an impact on euro area monetary aggregates
In general, the impact of cumulative revisions on the broad monetary aggregate M3 remained insignificant in terms of monthly growth rates. Moreover, the impact of the revisions received (measured by root mean square (RMS), as defined below) for the reference period of this report (January 2023 to December 2024) was relatively small across most time lags when compared with the August 2005 to December 2024 reception period.
Given that growth rates are published to one decimal place, changes of less than 0.05 percentage points do not, in practice, affect the published figures. In this regard, approximately 66% of all M3 growth rates were practically unchanged following the revisions received from August 2005, with their cumulative impact at t+12 being less than 0.05 percentage points in absolute terms (see Table 5). Over the same reception period, 86% and 96% of the initially published growth rates were subsequently revised by less than 0.10 and 0.20 percentage points respectively. These revisions were slightly higher for the reception period running from January 2023 to December 2024, with 71%, 87% and 95.8% of the initially published M3 growth rates being impacted by changes of less than 0.05, 0.10 and 0.20 percentage points respectively (see Table 5).
Using the same 0.05 percentage point metric, the figure for unchanged M3 growth rates at time lag t+1 has been 80% since July 2005 (88% since December 2022). At time lag t+3, the figure has been 70% since May 2005 (83% since October 2022), while at time lag t+6, the figure has stood at 67% since February 2005 (83% since July 2022).
Looking at revisions received since August 2005, the bias (simple average) vis-à-vis early estimates for month-on-month M3 growth rates has ranged from -0.0004 percentage points at time lag t+1 to 0.0049 percentage points at t+12 (see Table 5), which are negligible values.
The RMS of the total impact on the M3 growth rate has ranged from 0.056 percentage points at time lag t+1 to 0.091 percentage points at time lag t+12.
The cumulative revisions received since January 2023 have broadly had a marginally higher impact on the M3 growth rate than in the years leading up to that point. More precisely, the RMS impact at t+12 was 0.1 percentage points, compared with 0.09 percentage points for all revisions received from August 2005 onward, indicating somewhat larger revisions in the recent period.
Table 5
Impact of cumulative revisions on initially released M3 growth rates
Monthly revisions received from August 2005 to December 2024
(in basis points)
Time lag (months) |
T+1 |
T+3 |
T+6 |
T+12 |
|---|---|---|---|---|
Number of months |
235 |
235 |
234 |
228 |
Average impact |
-0.04 |
-0.43 |
-0.43 |
-0.49 |
Standard deviation (n-1) |
5.60 |
6.69 |
6.89 |
9.10 |
RMS impact |
5.58 |
6.69 |
6.88 |
9.09 |
Maximum impact |
24.94 |
25.56 |
25.01 |
45.60 |
Minimum impact |
-22.80 |
-31.18 |
-31.16 |
-46.04 |
| Impact | <= 0.01 p.p. |
24.7% |
18.3% |
17.5% |
17.5% |
| Impact | <= 0.05 p.p. |
79.6% |
70.6% |
67.1% |
66.2% |
| Impact | <= 0.10 p.p. |
91.5% |
88.9% |
89.3% |
86.0% |
| Impact | <= 0.20 p.p. |
99.1% |
98.3% |
98.3% |
95.6% |
Monthly revisions received from January 2023 to December 2024
(in basis points)
Time lag (months) |
T+1 |
T+3 |
T+6 |
T+12 |
|---|---|---|---|---|
Number of months |
24 |
24 |
24 |
24 |
Average impact |
-0.24 |
0.18 |
-0.03 |
-1.49 |
Standard deviation (n-1) |
3.82 |
4.37 |
4.34 |
10.52 |
RMS impact |
3.75 |
4.28 |
4.25 |
10.41 |
Maximum impact |
6.69 |
7.46 |
7.31 |
19.07 |
Minimum impact |
-9.10 |
-10.29 |
-10.50 |
-42.55 |
| Impact | <= 0.01 p.p. |
16.7% |
20.8% |
37.5% |
33.3% |
| Impact | <= 0.05 p.p. |
87.5% |
83.3% |
83.3% |
70.8% |
| Impact | <= 0.10 p.p. |
100.0% |
95.8% |
95.8% |
87.5% |
| Impact | <= 0.20 p.p. |
100.0% |
100.0% |
100.0% |
95.8% |
Looking at how revisions evolve over time, initial revisions usually take place fairly promptly, mostly within the first three months of initial release, and no significant further revisions would then be received in the subsequent periods. This is generally what occurs in practice, as shown in Chart 1 and 2 below.
Chart 1
Impact on initially released M3 growth rates of cumulative revisions received monthly from August 2005 to December 2024
(in basis points)

Chart 2
Impact on initially released M3 growth rates of cumulative revisions received monthly from January 2021 to December 2024
(in basis points)

Contribution of revisions in instruments to overall M3 revisions
When assessing how individual instruments contribute to revisions of M3, it is important to take account of the weight of each instrument in the aggregate figure. Chart 3 below provides a breakdown of contributions to M3 revisions. The largest contributions to overall M3 revisions primarily stem from “debt securities issued with a maturity of up to two years”, “overnight deposits” and “MMF shares/units”.
Chart 3
Breakdown of contributions to M3 revisions
(in basis points)

Revision analysis of euro area MFI interest rate statistics
In the following revision analysis of MFI interest rate statistics, monthly data received from euro area NCBs covering reference periods from January 2023 to December 2024 were used to analyse revisions to euro area aggregates. Only revisions equal to or greater than 1 basis point were considered, as revisions of less than 1 basis point are not visible in the published data.
As shown in Chart 4, revisions to euro area aggregates of MFI interest rate indicators are generally very small and exhibit a higher concentration in the lower range (−5 to +5 basis points). These revisions typically occur within a short time lag (t+1 and t+6)[12], with nearly half of all revisions taking place within the first six months of the initial release. This pattern suggests that after an initial revision – usually occurring in the month immediately following the first release (i.e. “ordinary revisions”) or shortly thereafter – there are relatively few significant revisions in subsequent periods.[13] It is worth noting that, over the periods covered by this analysis, a few NCBs occasionally revised specific time periods for the back data, which is reflected by the higher number of exceptional revisions shown by the light blue bars in Chart 4.[14]
Chart 4
Revisions of euro area aggregates for MIR statistics
(x-axis: size of the revision in basis points; y-axis: number of occurrences)
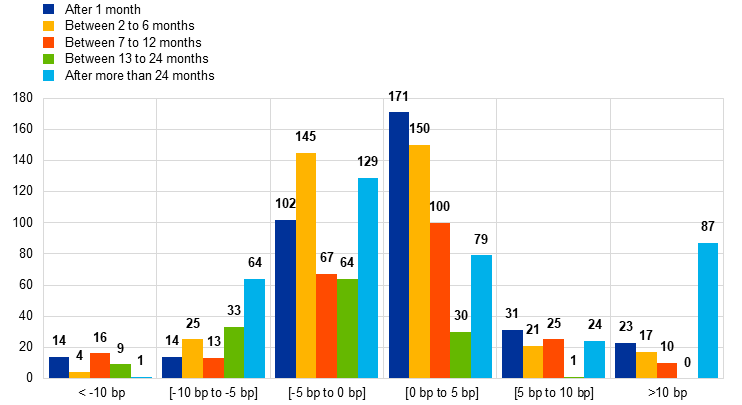
Around 71% of all revisions fall within the range of −5 to 5 basis points (see Table 6). With respect to the time lag, 24% of the revisions happen in the month following the initial release (ordinary revisions). Other revisions can be divided as follows: 25% relate the periods 2 to 6 months prior to the current reference month, 16% to periods 7 to 12 months prior, 9% to periods 13 to 24 months prior, and 26% to periods beyond 24 months from the reference month (see Table 7). In addition, several NCBs have submitted, via a single monthly transmission, revisions of several time series by reporting agents with an impact on euro area aggregates for at least 12 reference periods. In this analysis, this category of revision is considered “ad hoc”, owing to the exceptional reasons for their occurrence and their particular characteristics.
Table 6
Range |
Number of revisions |
Total share of revisions (%) |
Number of ad hoc revisions |
Total share of revisions excluding ad hoc revisions (%) |
|---|---|---|---|---|
[−5 to 5] |
2069 |
74 |
1032 |
71 |
[−10 to −5 [and] +5 to +10] |
430 |
15 |
179 |
17 |
<−10 and >+10 |
287 |
10 |
106 |
12 |
Table 7
Number of revisions per time lag
Time lag |
Number of revisions |
Total share of revisions (%) |
Number of ad hoc revisions |
Total share of revisions excluding ad hoc revisions (%) |
|---|---|---|---|---|
After 1 month |
414 |
15 |
59 |
24 |
After 2 to 6 months |
455 |
16 |
93 |
25 |
After 7 to 12 months |
348 |
12 |
117 |
16 |
After 13 to 24 months |
341 |
12 |
204 |
9 |
After 24 months |
1228 |
44 |
844 |
26 |
The sample mean of revisions affecting euro area aggregates is 0 basis points, while the corresponding absolute mean is 0.05 basis points.
The number of revisions is actually very small compared with the number of indicators used for the analysis (106) and the potential number of reference periods revised (from December 2024 back to January 2003, with a monthly frequency). Furthermore, it is worth noting that 10% of the indicators in the study were not revised during the period under analysis.
Overall, in comparison with the number of observations, the number and size of revisions to the MFI interest rate statistics at the euro area level are relatively small, showing that they are reliable. The number of exceptional and ad hoc revisions, as opposed to ordinary revisions, shows that MFI interest rate statistics are being continuously updated and, therefore, that their accuracy continues to improve.
“Internal consistency” refers to the set of checks conducted for MFS to ensure that all linear constraints are correctly fulfilled in the data received, such as by checking whether balance sheet items and their sub-totals add up to the total figures reported.
Consistency checks are also performed across frequencies of the same dataset, perhaps to check whether the sum of monthly transaction values matches the quarterly values, or whether year-end stocks equal end-December stocks.
Overall, the internal consistency checks carried out confirmed the consistency of MFS in 2023 and 2024. Where issues were observed, the NCBs concerned were contacted and asked either to revise or to justify the data accordingly.
The internal consistency check failures observed (relating, for example, to FVC statistics) may sometimes be due to the valuation methods used (such as differences between nominal and acquisition value), or reclassifications.
Plausibility checks are also conducted for MFS to detect outliers in the reported data. This is accomplished by reviewing the time series of the variable concerned. For instance, for statistics with a pronounced seasonal pattern, the most recent figure is compared with the data reported for the same period in previous years. Values that deviate markedly from the usual pattern of the series are isolated and analysed further.
For MFI balance sheet statistics, data compilers use autoregressive integrated moving average (ARIMA) models to assess the plausibility of newly received national data. The same approach is applied to euro area aggregates. An ARIMA-based outlier detection model is also used for MIR statistics and is applied to the raw data transmitted by the countries concerned as part of the regular data checks.
With regard to MFI balance sheet statistics, Chart 5 below shows annual flows in excess of inter-MFI liabilities between 2012 and 2024. This excess represents the residual figure obtained by netting reported inter-MFI liabilities and assets across the euro area to yield a consolidated balance sheet of the MFI sector, and is one of the counterparts of the broad money aggregate M3.[15] While some minor discrepancies between inter-MFI assets and liabilities are to be expected on a month-to-month basis, perhaps due to timing differences in recording a transaction between two MFIs, any such differences should conceptually net out over a longer period of time.
While some significant discrepancies have been observed in certain years, they do not appear to demonstrate a clear pattern and the series has experienced a fair share of highs and lows throughout its evolution. Thus, we can conclude that there is no recurrent behaviour over time, whether in terms of annual flows or in their composition. However, when analysing the breakdown of flows by different combinations of reference and counterpart sectors and areas, it becomes evident that the discrepancies largely relate to transactions between other MFIs, both domestically and cross-border. In 2023, the discrepancy in transactions between domestic other MFIs exceeded €45 billion, decreasing to €24 billion in 2024. In recent years, total discrepancies have slightly increased in magnitude compared with the pre-2020 period.
Chart 5
Excess of euro area inter-MFI liabilities
(annual flows, EUR billions)

Notes: “Other MFI” refers to MFIs excluding the Eurosystem. The combination “other MFIs – NCB” represents the difference between deposits reported by other MFIs vis-à-vis the NCB and loans reported by the NCB vis-à-vis other MFIs.
The MFS function performs various checks to assess the consistency of the data received with other datasets. For instance, MFI balance sheet statistics received by the ECB statistical function on the cross-border positions of euro area banks are compared with similar data collected by the Bank for International Settlements.
Comparisons across different types of statistics, such as those set out below, are also conducted.
8.1 Comparing loan-level AnaCredit data with MFI balance sheet statistics
In addition to national BSI aggregates, NCBs transmit individual, or bank-level, BSI data to the ECB for a broad set of indicators.[16] These individual BSI (IBSI) data cover a substantial share of the total assets of MFIs. Where available, IBSI loan data are used by the ECB to conduct regular data quality and consistency checks of the analytical credit (AnaCredit) dataset.
Plausibility checks[17] to compare AnaCredit data with individual banks’ BSI data on loans to corporations resident in the euro area have been performed on a quarterly basis since they formally commenced in 2021. The main purpose of these checks is to verify the completeness of loan-level AnaCredit data against benchmark IBSI aggregates, and to assess consistency between the datasets.
The overall coverage of total loans reported by euro area banks in AnaCredit has been steadily increasing in recent years and was close to 100% of the respective IBSI benchmark at the end of 2024. However, despite this broadly positive trend, notable discrepancies remain when comparing sectors and performing certain other breakdowns.
Collaboration between WG AnaCredit and WG MFS aims to enhance data quality and convergence, while also contributing to the broader objective of integrating the granular and aggregate reporting of statistical information through the implementation of the Integrated Reporting Framework (IReF)[18].
8.2 Comparing MFI balance sheet items with FVC statistics
A substantial portion of FVC balance sheet items relates to securitised loans originated by euro area MFIs, thus creating a link between FVC and BSI statistics.
With regard to the latter, under Part 5 of Annex I to the BSI Regulation (ECB/2021/2), MFIs are required to report a comprehensive set of information on loans, securitised or otherwise, on a monthly and quarterly basis. This includes data on off-balance-sheet securitised loans (i.e. derecognised loans) that continue to be serviced by the MFIs concerned.
Data on securitised loans that are not serviced and on non-securitised off-balance sheet loans are collected under the MFI Guideline (ECB/2021/11), insofar as that information is available to the NCBs.
It is therefore possible to (approximately) compare, at an aggregated level, the FVC flows of securitised loans originated by euro area MFIs with the following BSI securitised loan flows:
- net flows transferred to euro area FVCs (BSI Regulation);
- derecognised loans serviced by MFIs (BSI Regulation);
- other available data on derecognised loans (MFS Guideline);
- non-derecognised loans on MFI balance sheets securitised using euro area FVCs (BSI Regulation).
Based on the available breakdowns, comparisons between these datasets are most useful when the MFI originating the securitised loans and the FVC are resident in the same country. Conversely, the data are less comparable in the case of cross-border loan transfers, which can often happen due to the nature of securitisation activity. As a result, these checks are more relevant for certain countries than for others. While these checks can sometimes identify inconsistencies and reporting errors, underlying assumptions and conceptual differences often make it hard to draw firm conclusions.
8.3 MIR statistics – synthetic mean absolute error
With the entry into force of Guideline ECB/2014/15, the synthetic mean absolute error (MAE) was introduced as a measure of sample quality in MIR statistics. In particular, if an NCB relies on sampling to determine the reporting population and selects the largest institutions in each stratum, the actual synthetic MAE should not exceed a time-varying MAE threshold, assuming a 10-basis-point error difference in each stratum and indicator. If the NCB uses random sampling in its selection of reporting institutions, the maximum random error functions as a measure of sample quality and should not, on average, exceed 10 basis points at a confidence level of 90%.
According to the Guideline, NCBs should check the representativeness of their sample at least once a year. Any significant changes in the reference reporting population must be reflected in the sample. Moreover, NCBs must regularly review the sample at least once every three years. A new estimate of sample quality must be provided after each sample maintenance round.
Annex A: MIR statistics methods by EU country
The tables below contain a summary, by EU country, of the methods used for MIR statistics.
Table A
Methods for selecting the actual reporting population
Country |
Census |
Sample |
|---|---|---|
BE |
X |
|
BG |
X |
|
CZ |
X |
|
DK |
X |
|
DE |
X |
|
EE |
X |
|
IE |
X |
|
GR |
X |
|
ES |
X |
|
FR |
X |
|
HR |
X |
|
IT |
X |
|
CY |
X |
|
LV |
X |
|
LT |
X |
|
LU |
X |
|
HU |
X |
|
MT |
X |
|
NL |
X |
|
AT |
X |
|
PL |
X |
|
PT |
X |
|
RO |
X |
|
SI |
X |
|
SK |
X |
|
FI |
X |
|
SE |
X |
Table B
Specific measures performed in countries applying a sampling approach
Country |
Calculation of intra-stratum variance |
Calculation of total variance of the reporting population |
Calculation of expansion factors |
Maximum random error |
MAE measures |
Other |
|---|---|---|---|---|---|---|
BE |
X |
|||||
BG |
||||||
CZ |
||||||
DK |
X |
X |
||||
DE |
X |
X |
||||
EE |
||||||
IE |
X |
X |
||||
GR |
X |
X |
X |
|||
ES |
X |
X |
||||
FR |
X |
X |
X |
X |
||
HR |
||||||
IT |
X |
X |
X |
X |
||
CY |
||||||
LV |
||||||
LT |
X |
X |
||||
LU |
X |
|||||
HU |
||||||
MT |
||||||
NL |
||||||
AT |
X |
X |
X |
X |
||
PL |
X |
X |
X |
X |
||
PT |
||||||
RO |
||||||
SI |
||||||
SK |
||||||
FI |
||||||
SE |
X |
X |
Table C
Number of banks currently in the MIR sample and how often that sample is reviewed
Country |
Number of banks |
Frequency of review |
|---|---|---|
BE |
28 |
Annual |
BG |
||
CZ |
||
DK |
32 |
Annual |
DE |
199 |
Annual |
EE |
||
IE |
12 |
Annual |
GR |
14 |
Annual |
ES |
79 |
Annual |
FR |
208 |
Every five years |
HR |
||
IT |
69 |
Every three years |
CY |
||
LV |
||
LT |
16 |
Annual |
LU |
73 |
Annual |
HU |
||
MT |
||
NL |
||
AT |
114 |
Annual |
PL |
17 |
Annual |
PT |
||
RO |
||
SI |
||
SK |
||
FI |
||
SE |
26 |
Annual |
Table D
Countries reporting local events (e.g. IT incidents, reporting agent issues, etc.) in the last 24 months with the potential to undermine data quality
Country |
Yes |
No |
|---|---|---|
BE |
X |
|
BG |
X |
|
CZ |
X |
|
DK |
X |
|
DE |
X |
|
EE |
X |
|
IE |
X |
|
GR |
X |
|
ES |
X |
|
FR |
X |
|
HR |
X |
|
IT |
X |
|
CY |
X |
|
LV |
X |
|
LT |
X |
|
LU |
X |
|
HU |
X |
|
MT |
X |
|
NL |
X |
|
AT |
X |
|
PL |
X |
|
PT |
X |
|
RO |
X |
|
SI |
X |
|
SK |
X |
|
FI |
X |
|
SE |
X |
Table E
Quality and consistency checks routinely performed
Country |
Internal consistency of individual MIR |
Internal consistency of aggregated MIR |
Comparison between MIR new business volumes and BSI flows |
Comparison with AnaCredit data |
Deterministic outlier detection |
Model-based outlier detection |
ECB outlier detection |
Individual MFI outlier compared with the reporting population |
Other |
|---|---|---|---|---|---|---|---|---|---|
BE |
X |
X |
X |
X |
X |
X |
|||
BG |
X |
X |
X |
X |
|||||
CZ |
X |
X |
X |
X |
|||||
DK |
X |
X |
X |
X |
X |
||||
DE |
X |
X |
X |
X |
X |
X |
|||
EE |
X |
X |
X |
X |
X |
||||
IE |
X |
X |
X |
||||||
GR |
X |
X |
X |
X |
X |
X |
X |
||
ES |
X |
X |
X |
X |
X |
X |
X |
||
FR |
X |
X |
X |
X |
|||||
HR |
X |
X |
X |
X |
X |
X |
|||
IT |
X |
X |
X |
X |
X |
X |
|||
CY |
X |
X |
X |
X |
|||||
LV |
X |
X |
X |
X |
X |
X |
|||
LT |
X |
X |
X |
X |
X |
||||
LU |
X |
X |
X |
X |
X |
X |
X |
||
HU |
X |
X |
X |
X |
X |
X |
X |
||
MT |
X |
X |
X |
X |
X |
X |
X |
X |
|
NL |
X |
X |
X |
X |
X |
X |
X |
||
AT |
X |
X |
X |
X |
X |
X |
X |
||
PL |
X |
X |
X |
X |
X |
||||
PT |
X |
X |
X |
X |
|||||
RO |
X |
X |
X |
X |
X |
||||
SI |
X |
X |
X |
||||||
SK |
X |
X |
X |
X |
X |
X |
X |
||
FI |
X |
X |
X |
X |
X |
X |
X |
||
SE |
X |
X |
X |
X |
X |
X |
© European Central Bank, 2025
Postal address 60640 Frankfurt am Main, Germany
Telephone +49 69 1344 0
Website www.ecb.europa.eu
All rights reserved. Reproduction for educational and non-commercial purposes is permitted provided that the source is acknowledged.
For specific terminology please refer to the ECB glossary (available in English only).
PDF ISBN 978-92-899-7520-9, ISSN 2363-0191, doi:10.2866/1342974, QB-01-25-267-EN-N
HTML ISBN 978-92-899-7519-3, ISSN 2363-0191, doi:10.2866/5733111, QB-01-25-267-EN-Q
Legal Disclaimer:
EIN Presswire provides this news content "as is" without warranty of any kind. We do not accept any responsibility or liability for the accuracy, content, images, videos, licenses, completeness, legality, or reliability of the information contained in this article. If you have any complaints or copyright issues related to this article, kindly contact the author above.
